Probability of auroras
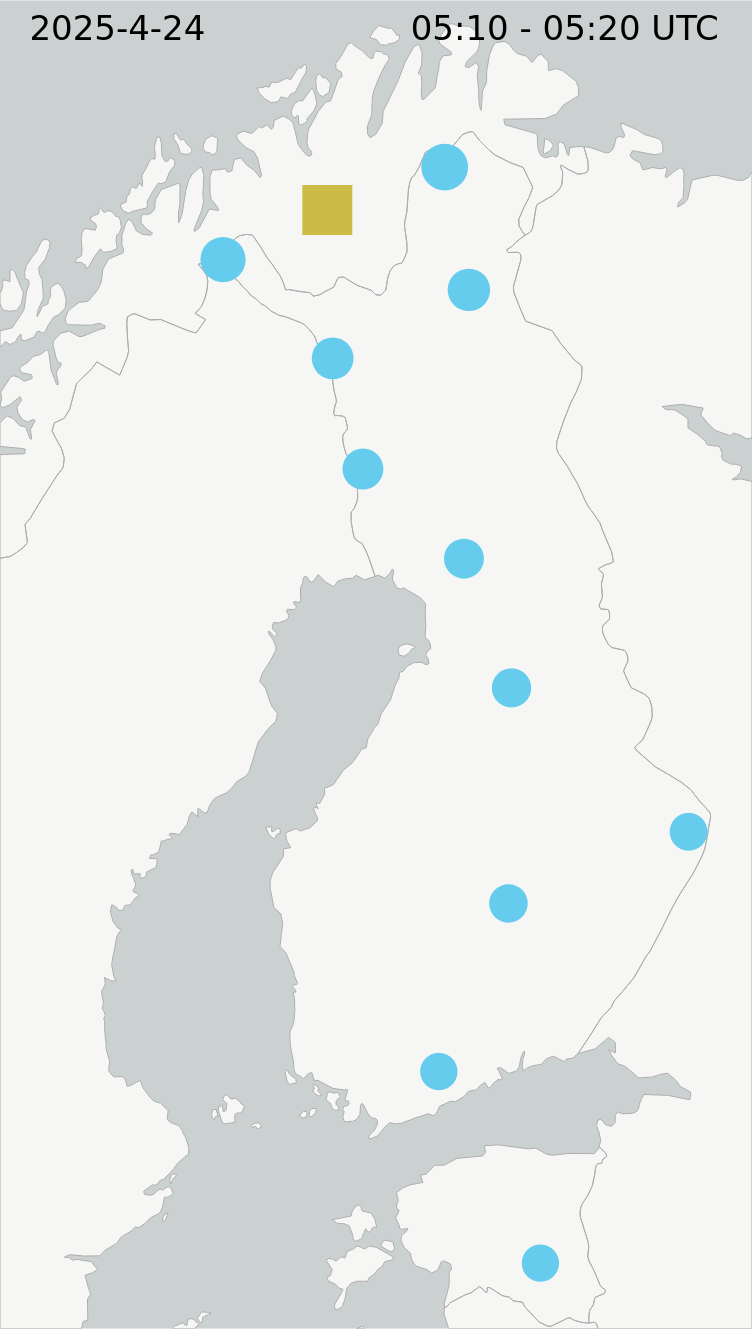
Probability of auroras estimated from the level of geomagnetic activity:
Blue: no activity
Yellow: medium activity
Red: high activity
Black: no data.
Activity forecast, 1 hour
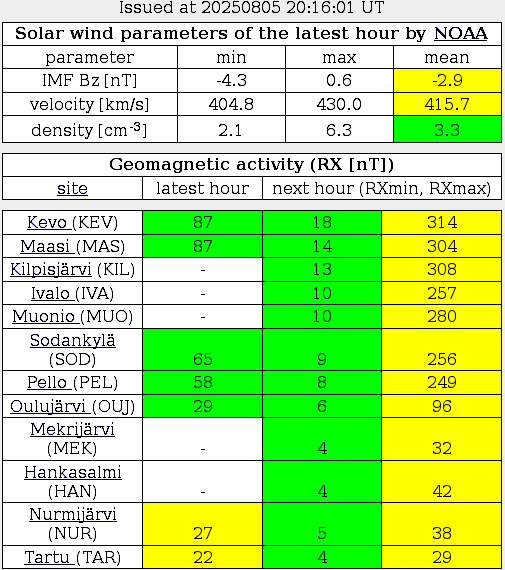
Geomagnetic activity forecast based on solar wind data. The two values for the next hour give an interval, where RX will be at a 90 % probability. RX is the range of the North component of the geomagnetic field. The colours indicate the level of activity:
low – increased – moderate – high – very high.
All-sky camera, Muonio
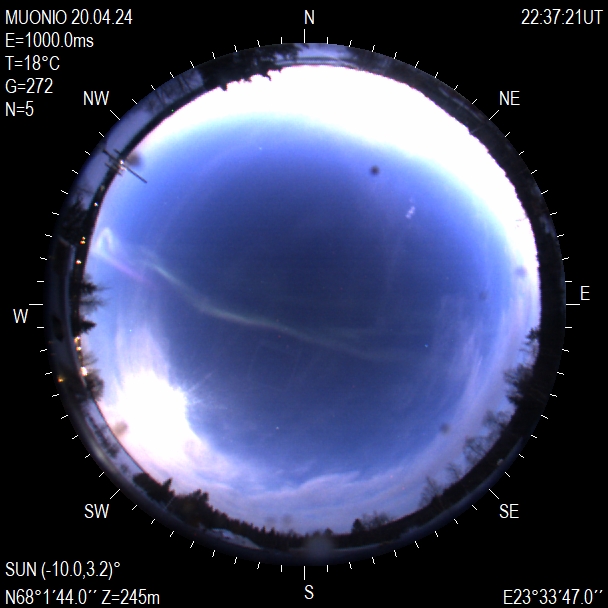
All-sky camera image from Muonio, northern Lapland. The image is not updated during daylight hours.
Ionospheric TEC
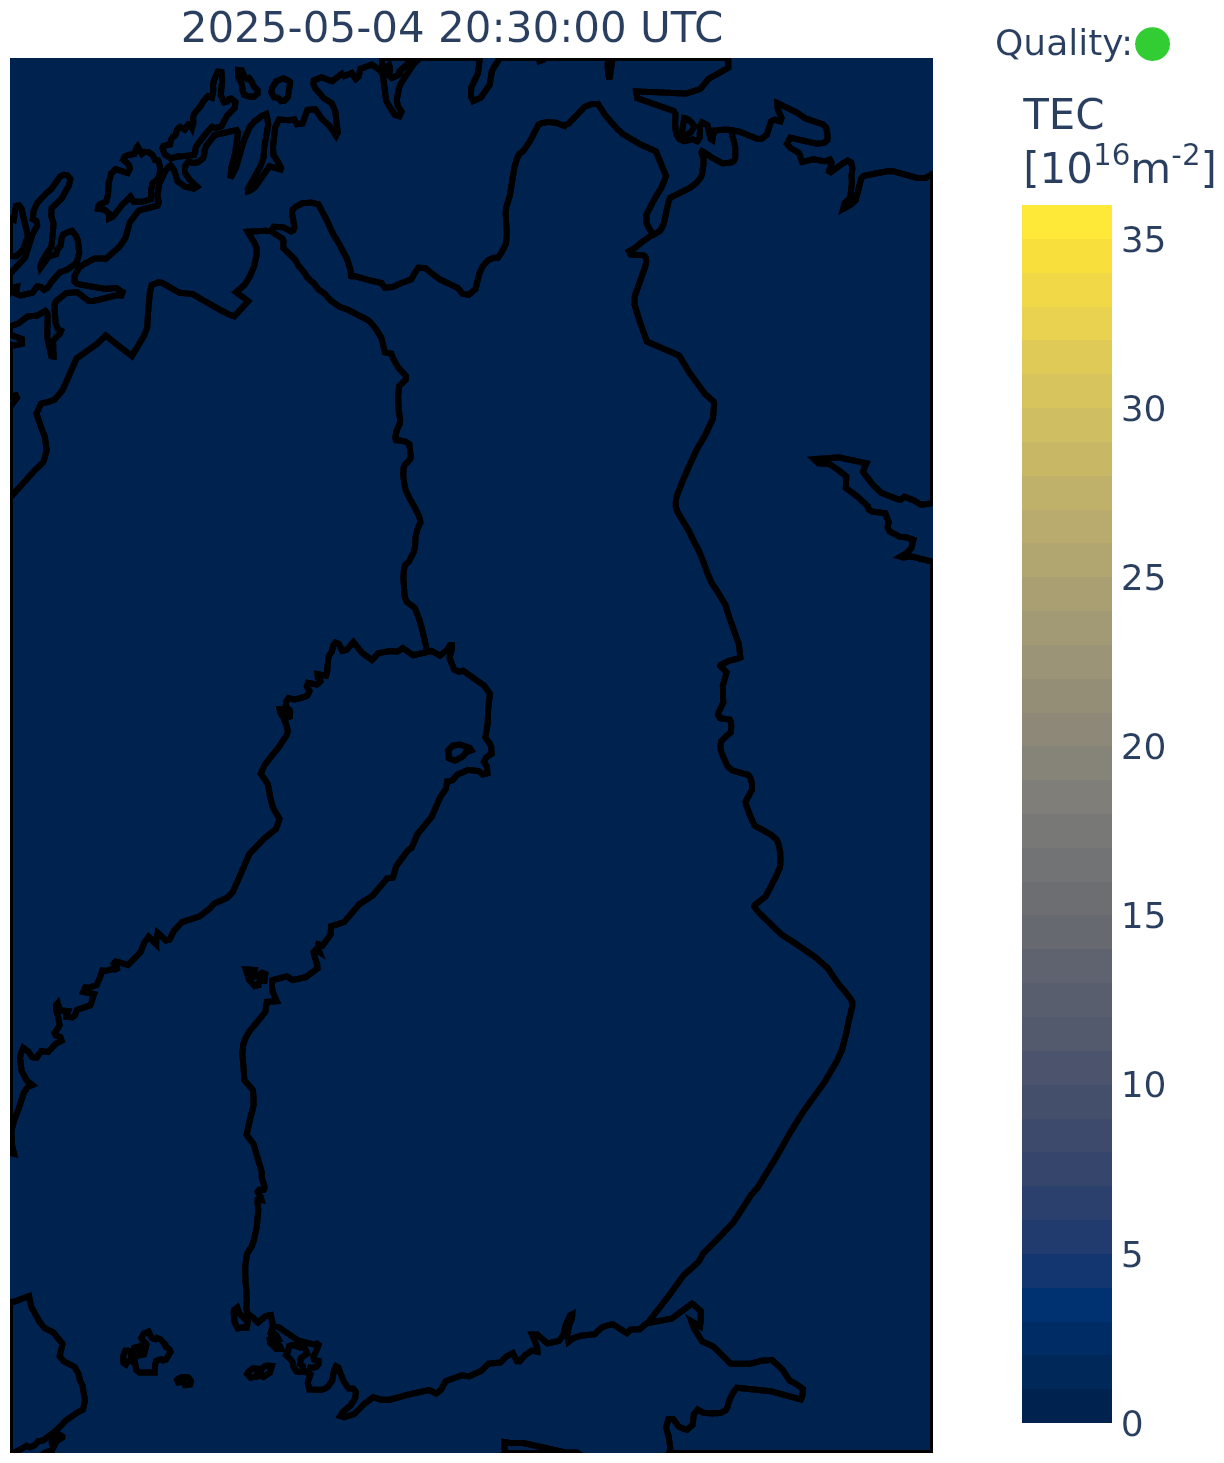
Height-integrated electron density in the ionosphere.
Nurmijärvi K
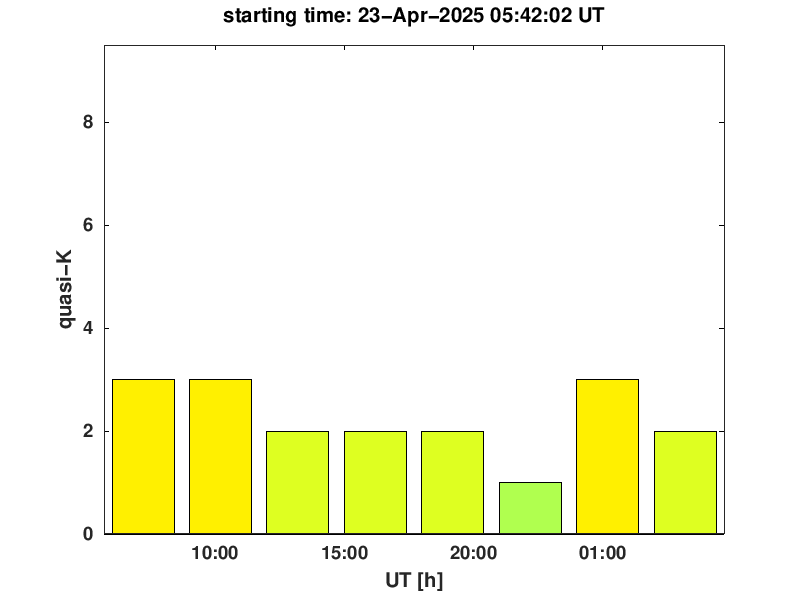
Local geomagnetic quasi-K index at Nurmijärvi, Southern Finland. The index is calculated automatically for moving three-hour periods, without subtracting daily variation.
Modelled GIC
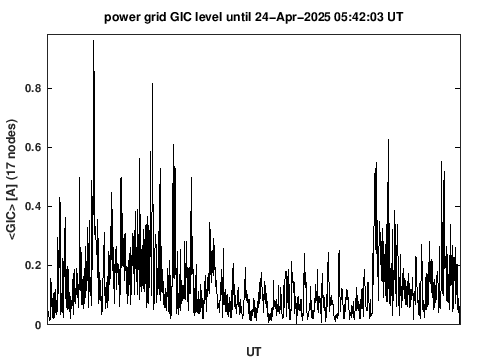
Modelled average geomagnetically induced current (GIC) in the Finnish power grid.
Sun
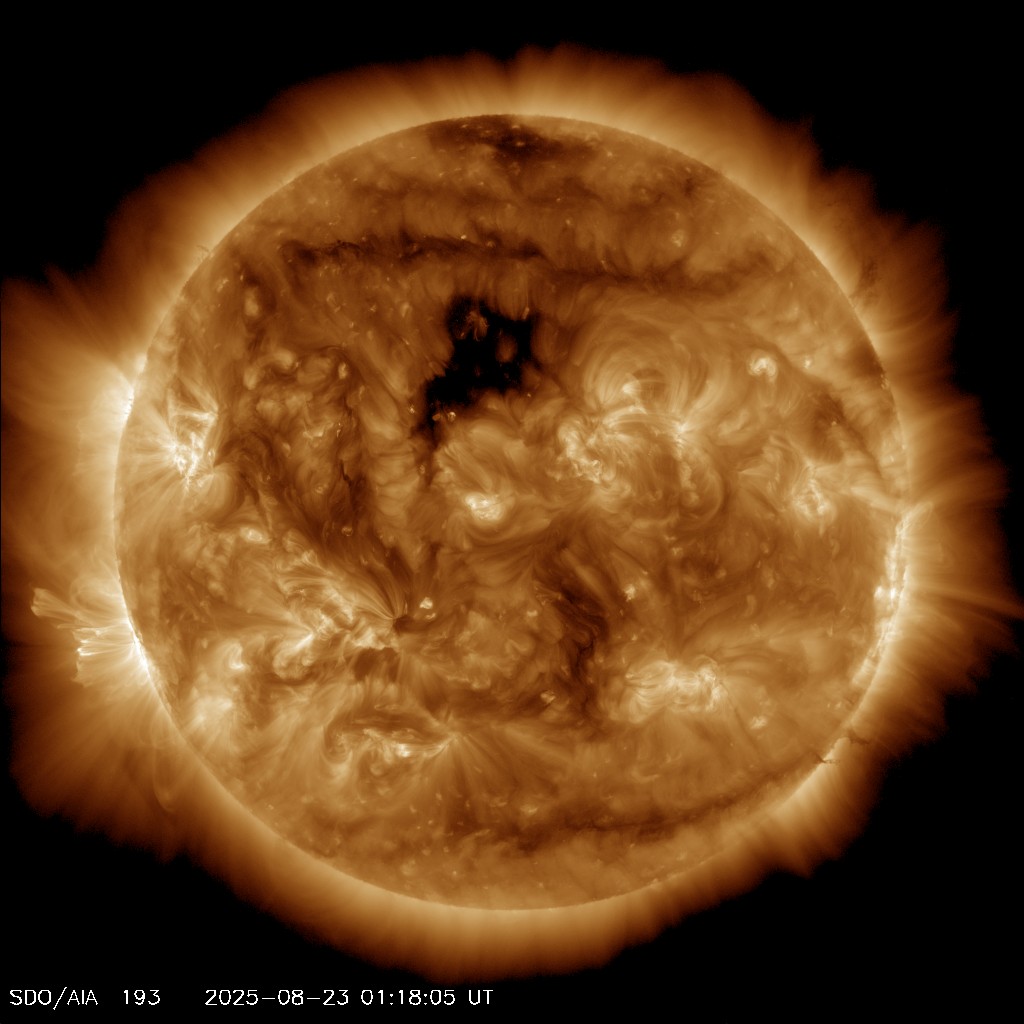
Solar image at 193 Å wavelength. Coronal holes, producing fast solar wind, are black. Active regions are light.